Types and Appearances of Reports
There is just one report design file for each report type. Due to different grouping, the reports generated of one file may appear in different ways.
Here we show only one exemplary variant of the many.
Some reports also contain several different charts.
|
Report Type | Report |
Efficiency Report |
The first page shows a summary of all elements of the selected grouping, e.g. for all patterns.
The following pages lists all elements of the selected grouping. |
User Efficiency Report | The user efficiency report can be selected as specific grouping in the report template of the efficiency report (two variants).
The first page shows a summary of all elements of the selected grouping.
The following pages lists all elements of the selected grouping. |
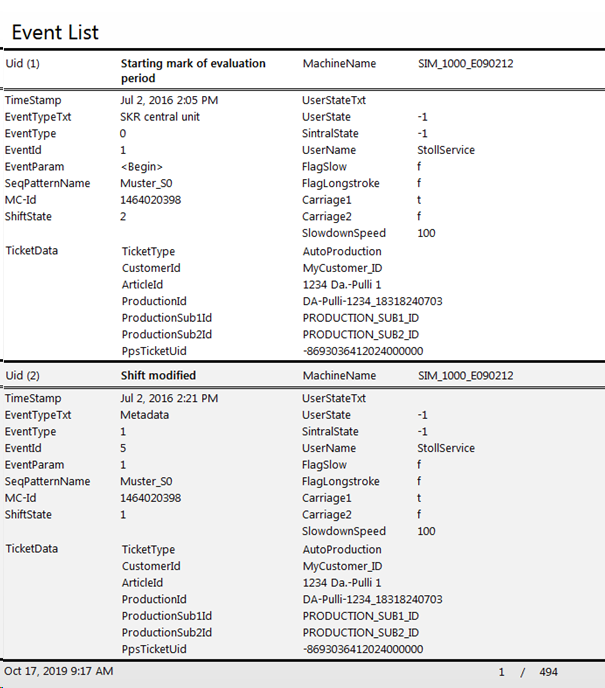
Event List |
This report lists all events in a tabular list. Recommendation:
|
Expected Quantities |
This report indicates the expected piece numbers of the production for all elements of the adjusted grouping (in this case days). The displayed piece numbers depend on the set filter parameters. |
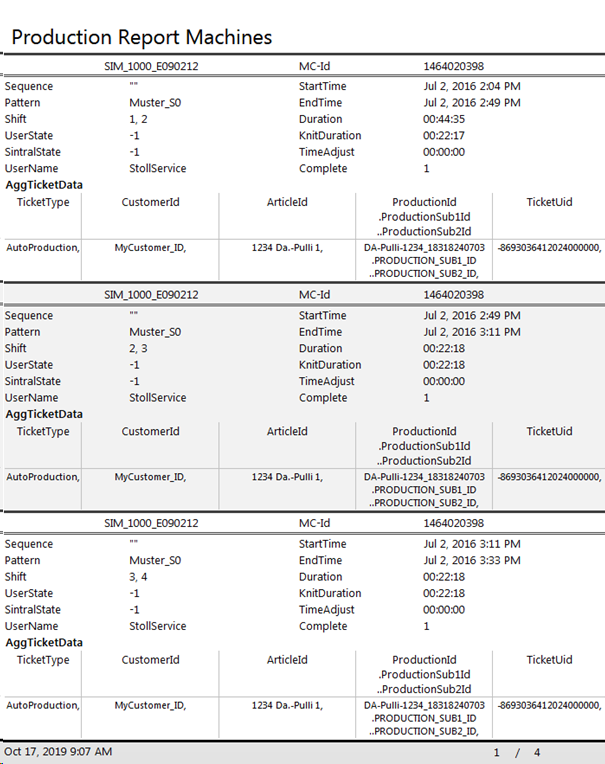
Production statistics machine |
This report lists the production data of all machines in a table. Recommendation:
|
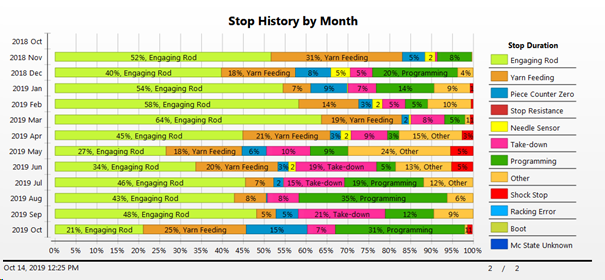
Stop History |
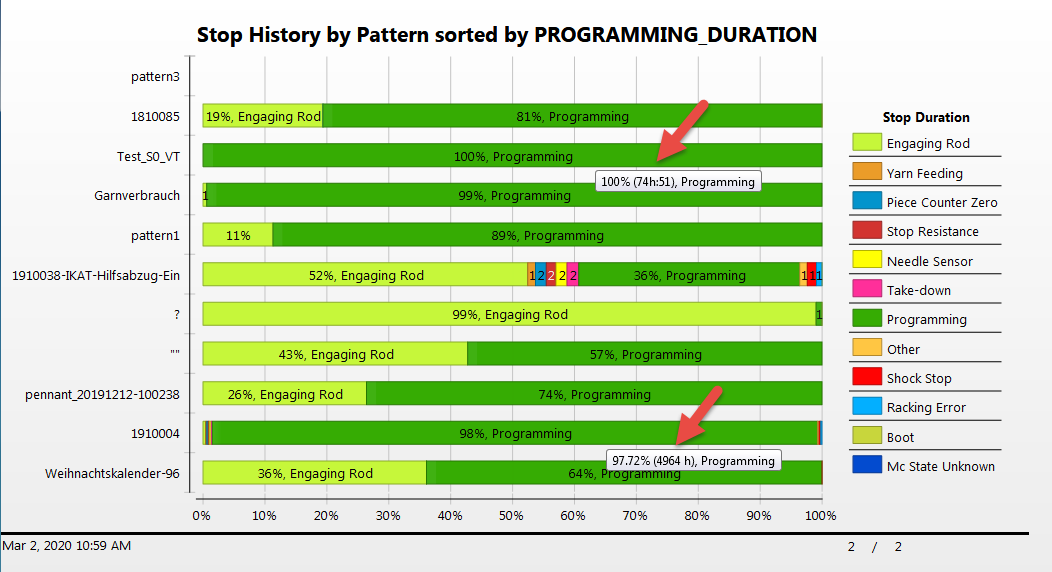
This report indicates the stop times for all elements of the adjusted grouping (in this case days) in relation to the grouped line in %. All stop times of a bar row result in 100 %. It is possible to sort including all lines by a specific stop time, e.g. if you want to know where you lost the most time with the stop take-down. Via the sorting filter you can sort by relative time (TAKE_DOWN_PC) or absolute time (TAKE_DOWN_DURATION). In the graphic it was sorted by the absolute stop time for the pattern processing. The absolute time in the output window at the top is less then the time at the bottom, though the bar at the top is longer. |
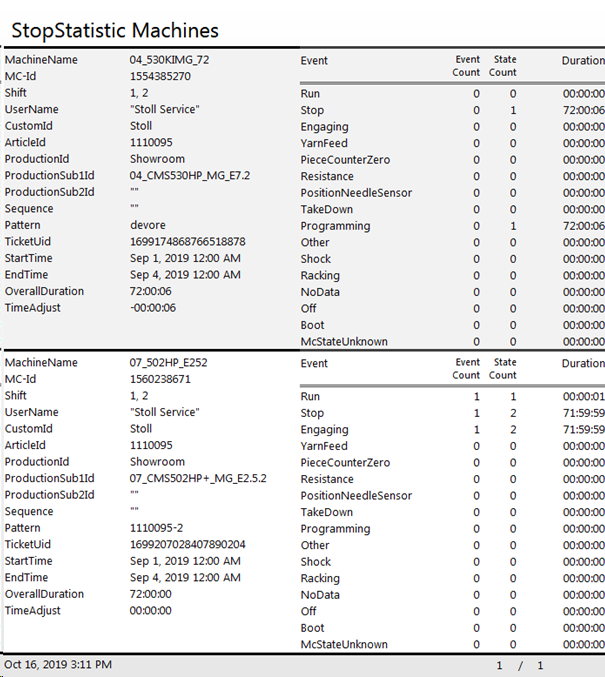
Stop motion statistics machines |
This report lists all stop times in a table. Recommendation:
|
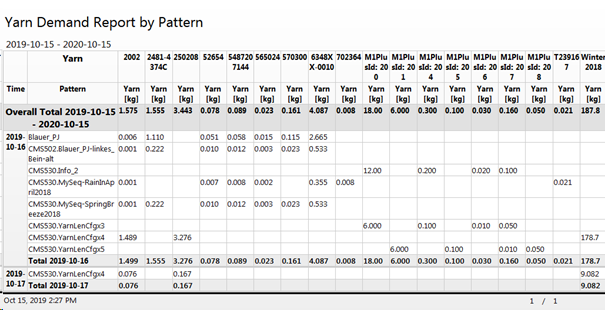
Yarn Demand |
This report lists all yarns expected to be needed in a table. Additionally, the sums of all grouping elements as well as the total sum are displayed. The yarn quantities result from the knitting programs of the orders, the production planning and the progress of the production. You can determine how much yarn must be fed in the time periods of the production and how much you need to have in total. |


