How to perform database queries for automation purposes
In order to increase the automation, it is possible to carry out queries about order distribution, capacity load, state of processing, quantity of pieces and setup state in the PPS database with the corresponding criteria.
For this, you can address Select queries to the PPS database.
In the following examples, the value assigned to d.uid is the UID of the machine.
To determine the UID out of the machine network name, you can use conversion functions or the skrpps_02.skr_get_mc_list function.
See: Different help functions for further performance optimized options.
Example:
SELECT "BO_GUID" from skrpps_02.skr_get_mc_list('skr') where "MC_NAME"='McNetworkName';
The query provides you the UID of the machine, if you enter the network name of your machine for McNetworkName.
From the PPS database you can determine:
- Quantity of orders
- orders still to be done, that are already assigned to the machines (APPROVED)
- currently in progress (IN_PROGRESS)
- currently in an activity (printing) (IN_ACTIVITY)
- SQL query:
SELECT count(t) FROM ticket t JOIN device d on t.device_id = d.id WHERE t.state in ('APPROVED', 'IN_PROGRESS', 'IN_ACTIVITY') AND d.uid='56665454' - Note:
If you replacecount(t)with*, you receive a table with information regarding the tickets and the machine.
This way, you can determine for ex. the names of the tickets or the state of completion, of the machine. - If you only want to know how many tickets are already in the ToDo state.
Therefore, replace …t.state in (…)by …t.state='APPROVED'. - Instead of
d.uid='56665454'you can also used.name='McNetworkName'ord.skrmachineid=1480329483, to avoid determining the UID.
But bear in mind that only the UID is unique. The network name can change. When you re-enter the machine in the SKR, the SKRID changes as well. - Time, until the machine will have processed all orders.
It is possible to determine, how long the machine will be busy processing the released orders. The basis for the calculation is the time per piece specified in the order and the shift efficiency set up as well as the value established in STOLL:PRODUCTION_EFFICIENCY tag, if it is being used. For orders with many pieces in progress an extrapolation towards the completion is performed. And with each piece the extrapolation approaches the real end time.
SQL query:SELECT max(t.endDate) FROM Ticket t JOIN Device d on t.device_id = d.id WHERE t.state in ('APPROVED','IN_PROGRESS', 'IN_ACTIVITY') AND d.uid='56665454' - When an order was completed?
For the query about the pps database, you have to know your order name (ordernumber) to identify the order (a).
Recommendation: Set the PRODUCTION_ID (productionid) in the order and identify the order with it (b).
The queries provide the information about when an order was completed. -
(a) SELECT aggregatedenddate FROM orders o WHERE state='DONE' AND ordernumber='ADF530-32W_REFLEX_30_08-20220503-093844' -
(b) SELECT aggregatedenddate FROM orders o WHERE state='DONE' AND productionid='20220503-093844' - When a ticket was completed?
In case an order is split and you want to determine when a ticket was completed, you have to carry out another query using the pps database. You should also know your order name here (ordernumber) to identify the order (a). Recommendation: Set the PRODUCTION_ID (productionid) in the order and identify the order with it (b).
The queries provide the information about when the last ticket from a split order was completed. -
(a) SELECT max(t.finished) FROM ticket t JOIN orders o on t.ppsproductionuid=o.productionuid WHERE t.state in ('DONE') AND o.ordernumber='ADF530-32W_REFLEX_30_08-20220503-093844' -
(b) SELECT max(t.finished) FROM ticket t JOIN orders o on t.ppsproductionuid=o.productionuid WHERE t.state in ('DONE') AND productionid='20220503-093844' - Which machine knitted the last piece?
- With the changeover to the Postgres database version ≥14, the PPS and the SKR database are merged to simplify the queries across databases.
-
(a) SELECT max(t.finished), skrpps_02.agg_at_min (extract(epoch from t.finished)::bigint, d.name) FROM ticket t JOIN orders o on t.ppsproductionuid=o.productionuid JOIN device d on d.id=t.device_id WHERE t.state in ('DONE') AND o.ordernumber='ADF530-32W_REFLEX_30_08-20220503-093844' - When has a specific machine completed the last ticket of a split order (ordernumber)?
- The machine is filtered using their UID (d.uid).
Other indications such as network name (d.name), MAC (d.macaddress) or IP (d.ipaddress) are also possible. -
SELECT max(t.finished) FROM ticket t JOIN orders o on t.ppsproductionuid=o.productionuid JOIN device d on d.id=t.device_id WHERE t.state in ('DONE') AND d.uid='56665454' AND ordernumber='ADF530-32W_REFLEX_30_08-20220503-093844' - How many pieces were produced?
- With a known order name
-
SELECT sum(t.executionsdone) FROM ticket t JOIN orders o on t.ppsproductionuid=o.productionuid WHERE ordernumber='ADF530-32W_REFLEX_30_08-20220503-093844' - With a known PRODUCTION_ID which was indicated in the ticket
-
SELECT sum(t.executionsdone) FROM ticket t JOIN orders o on t.ppsproductionuid=o.productionuid WHERE productionid= '20220503-093844' - Starting from the state of scheduling:
- When does an order start and end?
- What is the state of the order?
- How many pieces are produced?
- Which machines are involved?
- With known ProductionID
-
SELECT o.aggregatedstartdate, o.aggregatedenddate, o.state, sum(t.executionsdone) OVER (PARTITION BY o.aggregatedstartdate) AS aggregatedexecutionsdone, d.uid -
FROM public.orders o -
JOIN public.ticket t on o.productionuid=t.ppsproductionuid -
JOIN public.device d on t.device_id=d.id -
WHERE o.productionid='20220503-093844' AND o.state in ('PLANNED', 'APPROVED','IN_PROGRESS', 'IN_ACTIVITY', 'DONE'); - Query further data by appending to d.uid:
-
,o.id, o.ordernumber, o.articlenumber, o.productionid, o.productionsub1id, o.productionsub2id, o.customerid, o.totalnumberofexecutions, o.orderdescription, o.patternfilename, o.patternsubdirectory, o.productionuid, o.originalnumberofexecutions, o.state, o.delay - Setup state of the machine
- Via the PPS it is possible to distribute a setup order onto the machines.
The ticket template AutoProduction already contains two fields and to enter it.
A tag that defines a setup state can be used in the ticket. Several setup states can be defined if the setup state is appropriate for several fabrics. The setup state can also be determined with a knitting ticket if no setup orders are to be used. - The setup state is determined via this tag:
<STOLL:REQUIRED_SETUP_LEVELS>
    <STOLL:SETUP Level="F46r548"/>
    <STOLL:SETUP Level="F15r773"/>
     ...
</STOLL:REQUIRED_SETUP_LEVELS> - If such a ticket is set in production at the machine or is completed, machines with the
F46r548setup state can be detected.
SQL query of the pps database:SELECT d.name, d.uid, l.value from loopthroughitementry l JOIN orders_loopthroughitementry ol on l.id = ol.loopthroughitems_id JOIN Orders o ON o.id = ol.orders_id
JOIN Ticket t on t.order_id = o.id
JOIN Device d on t.device_id = d.id where
key='REQUIRED_SETUP_LEVELS' and l.value like '%"F46r548"%';
Query via a batch file, when a machine completes all the tickets
In the following example is queried the time, when the machine with a specific UID is done with all the tickets.
Copy the code into a batch file, set the Machine_UID variable to a value of one of your machines and execute the code with administrator rights. In the DONE_TIME variable, you receive the result of the query.
@echo off
setlocal enabledelayedexpansion

set "PgLatestRootPath=C:\Program Files\Stoll\skr3\PostgreSql\9.5.5-1\bin"
set "PgRootPath=!PgLatestRootPath!"
if not exist "!PgRootPath!" Set "PgRootPath=C:\Program Files\Stoll\skr3\PostgreSql\9.5.3-1\bin"

set "Machine_UID=56665454"
call :GetDoneTime !Machine_UID! DONE_TIME
echo DONE_TIME=!DONE_TIME!, ErrorLevel=!ErrorLevel!
goto :EOF

:GetDoneTime
    call :UndefErrorLevel
    set "MC_UID=%~1"
    set "ReturnDoneTimeValueRef=%~2"
    set "DataVal=NULL"
    set "PGPASSWORD=ppsfrontend"
    set "PGCLIENTENCODING=utf-8"

    set pd_SelCmd=SELECT max(t.endDate) FROM Ticket t JOIN Device d on t.device_id = d.id WHERE t.state in ('APPROVED','IN_PROGRESS', 'IN_ACTIVITY') AND d.uid='!MC_UID!';
    set pg_SelCall="!PgRootPath!\psql" -U ppsfrontend -h localhost -d pps
    set pg_cmd="echo !pd_SelCmd! | !pg_SelCall! || echo/ & echo/ & call echo NULL NULL %%^^^errorlevel%%"
    set "pg_cmd=!pg_cmd:)=^)!"

    REM Execute PG command and split up table at | and space. Resulting DataValue obtained from second column.
    REM Check for errors of call
    for /f "skip=2 tokens=1,2,3" %%i in ('!pg_cmd!') do (
        REM Get value in first and second parameter from split - which is from third row
        set "DataVal=%%i %%j"
        REM If error happend, report it. Error code is obtained in 3rd parameter.
        if "!DataVal!"=="NULL NULL" (
            echo ## Postgres DB operation failed with ERROR: %%~k
            set "DataVal=NULL"
        ) else (
            REM Check if not valid
            if "!DataVal:~0,1!"=="(" set "DataVal=NULL"
        )
        goto GotDoneTime
    )
:GotDoneTime
    if not '!ReturnDoneTimeValueRef!'=='' set "!ReturnDoneTimeValueRef!=!DataVal!"
    if "!DataVal!"=="NULL" set "ERRORLEVEL=1" & exit /b 1
exit /b 0

:UndefErrorLevel
REM Undefine ERRORLEVEL, otherwise !ERRORLEVEL! keeps last set value. The ERRORLEVEL system value is not the same as !ERRORLEVEL!
set "ERRORLEVEL="
exit /b 0
Output example:
D:\PPS\PpsJBossServer\PpsServerInstallScripts>GetDoneTimeByUID.bat
DONE_TIME=2017-07-18 13:57:33.818, ErrorLevel=0
Query specific standstill times:
- Standstill times with the following data:
- Machines in case of a failure
- Other standstills
- Total running time
- Maschinen mit SKR-ID1530603103und1530627696
Time period2018-08-26 12:00to2018-09-01 12:00
This information can be determined via individualized stop statistics.
Generating a Secondary DB and triggering an individualized report.
For testing purposes, you can do it with the pgAdmin Tool. In this example, static tables are used which will not be automatically deleted. The mydb table is used, which should be deleted in the report_01 schema after finishing the test.
Advantage of this method: You can enter the 2 selects into different SQL windows and view the generated tables in the report_01 schema.
- 1259
- Create Secondary DB tables.
SELECT * FROM skrpps_02.skr_create_secundary_db_tables_ex('report_01'::text ,'mydb'::text,'eUnlogged'::skrpps_02.e_sec_tabletype ,'skr'::text,ARRAY[1457359086, 1457359088],'2018-08-26 12:00'::timestamp,'2018-09-01 12:00'::timestamp,'2000','2:00:00'::interval); - 1260
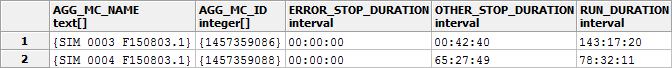
- Generate individual stop statistics.
- Add or subtract columns with arithmetic operations to obtain the desired result.
- Additionally the result columns receive their own names (ERROR_STOP_DURATIONandOTHER_STOP_DURATION).
- The table is sorted ascending via the first column (name of the machine).SELECT skrpps_02.skr_mcid2mcname( "AGG_MC_ID",'skr') AS "AGG_MC_NAME"
, "AGG_MC_ID",
("STOP_DURATION" - "ENGAGING_DURATION" - "PIECE_COUNTER_ZERO_DURATION" - "PROGRAMMING_DURATION" - "OFF_DURATION" - "BOOT_DURATION" - "NO_DATA_DURATION" - "MCSTATE_UNKNOWN_DURATION"
) AS "ERROR_STOP_DURATION",
("ENGAGING_DURATION" + "PIECE_COUNTER_ZERO_DURATION" + "PROGRAMMING_DURATION" + "OFF_DURATION" + "BOOT_DURATION" + "NO_DATA_DURATION" + "MCSTATE_UNKNOWN_DURATION") AS "OTHER_STOP_DURATION",
"RUN_DURATION"
FROM skrpps_02.eval_stop_statistic
(
'report_01' -- __sSchema text
,'mydb' -- _sTable_Prefix text
,Array['AGG_MC_ID'] -- _aSortorder text[]
,true -- _bGroupByMachine boolean
,false -- _bGroupByShift boolean
,false -- _bGroupByUserName boolean
,false -- _bGroupByPattern boolean
,false -- _bGroupBySeq boolean
,false -- _bGroupByTicketUid boolean
,false -- _bGroupByTicketProductionId boolean
,false -- _bGroupByTicketProductionSub1Id boolean
,false -- _bGroupByTicketProductionSub2Id boolean
,false -- _bGroupByTicketCustomerId boolean
,false -- _bGroupByTicketArticleId boolean
,NULL -- _aFilterShift integer[]
,NULL -- _aFilterUsername text[]
,NULL -- _aFilterPattern text[]
,NULL -- _aFilterSeq text[]
,NULL -- _aFilterTicketUid bigint[]
,NULL -- _aFilterTicketProductionId text[]
,NULL -- _aFilterTicketProductionsub1Id text[]
,NULL -- _aFilterTicketProductionsub2Id text[]
,NULL -- _aFilterTicketCustomerId text[]
,NULL -- _aFilterTicketArticleid text[]
,NULL -- _aFilterUserState Smallint[]
,NULL -- _aFilterSintralState Smallint[]
) where "OVERALL_DURATION" <> "NO_DATA_DURATION" order by 1 asc : With the delivered Excel program (StollReportFromSkrToExcel.xlsb) you can easily configure the basic filter settings and copy the select query.
How to Access the Database via ODBC
- Example result of the query
How to add an order directly to the database without generating a XML file
Instead of writing the order data into a XML file and saving it in the D:\ERP\Input folder, you can insert the order directly in the ticket_queue using a database connection to the pps database.
The following insert adds an order with minimal data record for the auto production to the ticket_queue. It is intended for reloading a Jacquard in case of a individual production with lot size 1. Other order variants are possible as well.
Using the example Excel file D:\PPS\ODBC_Examples\Excel\StollPpsTicketExportViaODBC.xlsm, you can develop further applications.
For this is necessary a ODBC connection to the pps and the skr database.
The knitting time (estimated_order_duration) is transferred in milliseconds.
Therefore, 20 min are to be entered as 20*60*1000=1200000.
INSERT INTO "ticket_queue" (
    ticket_number,
    ticket_type,
    pattern_subdirectory,
    pattern_file_name,
    total_num_of_executions,
    estimated_order_duration,
    custom_xml, machine_list_xml,
    order_description,
    pattern_preload_condition_xml
)
Values (
    '145609_bandage_2154879',
    'AUTO_PRODUCTION',
    'production\Spring2019',
    'CMSADF-3 KW.bandage_2154879.zip',
    1,
    1200000,
    '<STOLL:CUSTOM xmlns="http://schemas.custom.com/ticketing/ticket/v0.3" xmlns:xsi="http://www.w3.org/2001/XMLSchema-instance" xsi:schemaLocation="http://schemas.custom.com/ticketing/ticket/v0.3 CustomTicket.xsd"/>',
    '<STOLL:MACHINE_LIST>
        <STOLL:MACHINE Name="312_ADF-3KW" BoIgnore="1" Pieces="1"/>
    </STOLL:MACHINE_LIST>',
    'Ticket created by Sapas',
    '<STOLL:PATTERN_PRELOAD_CONDITION>
        <STOLL:ERASE_ALL State="false"/>
        <STOLL:ERASE_ALL_YARNCARRIERPOS State="false"/>
        <STOLL:ERASE_ALL_SEQYARNCARRIERPOS State="false"/>
        <STOLL:LOAD_PAT_CONTAINER_COMP SIN="false" JAC="true" SET="false"/>
    </STOLL:PATTERN_PRELOAD_CONDITION>'
)
Determine the pieces produced with the still running ticket based production
You want to determine, how many pieces of the running production were already produced on the machines?
By querying the PPS database as follows, you receive information about the production:
- how many pieces
- from how many machines
- on which machines
- which ticket
- which order
- how many unfinished tickets
SELECT d.name AS device_name, executionsdone, numberofexecutions, t.name AS ticket_name, ordernumber AS order_name, patternfilename FROM Ticket t JOIN Device d on device_id=d.id JOIN Orders o ON o.id = t.order_id WHERE o.type in ('GENERAL','AUTO_PRODUCTION', 'GUIDED_PRODUCTION') and t.state ='IN_PROGRESS' order by order_name
Determine produced sequences per day and machine:
- For example, if a sweater is knitted using a sequence and you want to determine how many sweaters were produced per day per machine over a certain period of time, you can do this using the EventList report:
- Machines with SKR-ID 1706536365, 1710405527, 1710409205, 1711546385, 1706535846, 1711443250, 1607342198, 1704803012, 1718697144, 1718692632
- Period from2024-04-09 00:00to2024-08-01 00:00After generating a Secondary DB, you can use the EventList Report. With it, the event filter for Sequence number increased (1,4) is used.
For testing purposes, you can do it with the pgAdmin Tool. In order for the 2 selects to run in the same session, the queries must be entered commonly in a SQL window.
- 1
- Create Secondary DB tables
SELECT * FROM skrpps_02.skr_create_secundary_db_tables_ex(''::text ,'mydb'::text,'eUnloggedTemp'::skrpps_02.e_sec_tabletype ,'skr'::text, ARRAY[1706536365, 1710405527, 1710409205, 1711546385, 1706535846, 1711443250, 1607342198, 1704803012, 1718697144, 1718692632],'2024-04-09 00:00'::timestamp,'2024-08-01 00:00'::timestamp,'2000','2:00:00'::interval); - 2
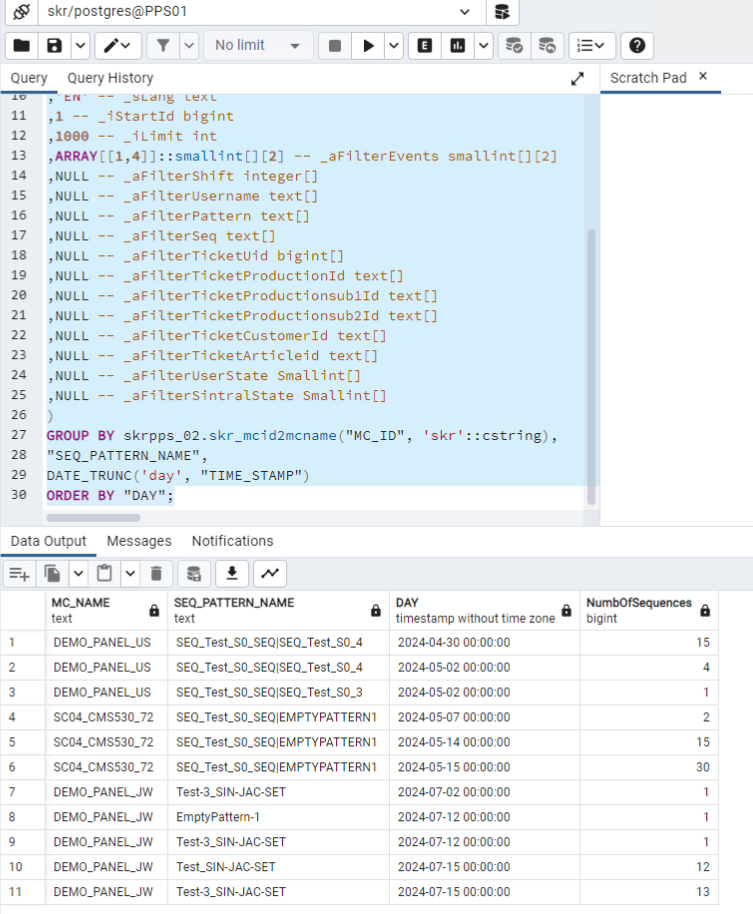
- Generate an individual EventList Report.
- Machines and sequences are grouped on a daily basis and the quantity of sequences is counted.
- The event table displays machine name, sequence name (may also contain pattern name), day and number of sequences.: The number of sequences will only be correct if production has run smoothly.
This query cannot take into account skipped or aborted sequence elements.Select skrpps_02.skr_mcid2mcname( "MC_ID",'skr'::cstring) AS "MC_NAME",
"SEQ_PATTERN_NAME",
DATE_TRUNC('day', "TIME_STAMP") AS "DAY",
COUNT(*) "NumbOfSequences"
from
skrpps_02.eval_event_list(
'' -- __sSchema text
,'mydb' -- _sTable_Prefix text
,'EN' -- _sLang text
,1 -- _iStartId bigint
,10000 -- _iLimit int
,ARRAY[[1,4]]::smallint[][2] -- _aFilterEvents smallint[][2]
,NULL -- _aFilterShift integer[]
,NULL -- _aFilterUsername text[]
,NULL -- _aFilterPattern text[]
,NULL -- _aFilterSeq text[]
,NULL -- _aFilterTicketUid bigint[]
,NULL -- _aFilterTicketProductionId text[]
,NULL -- _aFilterTicketProductionsub1Id text[]
,NULL -- _aFilterTicketProductionsub2Id text[]
,NULL -- _aFilterTicketCustomerId text[]
,NULL -- _aFilterTicketArticleid text[]
,NULL -- _aFilterUserState Smallint[]
,NULL -- _aFilterSintralState Smallint[]
)
GROUP BY skrpps_02.skr_mcid2mcname("MC_ID", 'skr'::cstring),
"SEQ_PATTERN_NAME",
DATE_TRUNC('day', "TIME_STAMP")
ORDER BY "DAY";: With the delivered Excel program (StollReportFromSkrToExcel.xlsb) you can easily configure the basic filter settings and copy the select query.
How to Access the Database via ODBC
- Example result of the query by the pgAdmin Tool
You Want to Generate the Intermediate Tables and Evaluation with One Call
In this example, the auxiliary table and the event list are generated at once.
Please note that in the event of an error, analysis will be more difficult. The first skr_create_secundary_db_tables_ex column should contain the value 0 throughout to ensure that the auxiliary table could be generated for all machines.
In the example, after the auxiliary tables have been generated, the Event List Report is executed.
You can replace this part of the SELECT with another report based on the auxiliary tables.
SELECT
skrpps_02.skr_create_secundary_db_tables_ex
(''::text ,'mydb'::text,'eUnloggedTemp'::skrpps_02.e_sec_tabletype ,'skr'::text, ARRAY[1706536365, 1710405527, 1710409205, 1711546385, 1706535846, 1711443250, 1607342198, 1704803012, 1718697144, 1718692632],'2024-04-09 00:00'::timestamp,'2028-08-01 00:00'::timestamp,'2000','2:00:00'::interval)
, skrpps_02.skr_mcid2mcname("MC_ID",'skr'::cstring) AS "MC_NAME"
skrpps_02.eval_event_list
,* from (
'' -- __sSchema text
,'mydb' -- _sTable_Prefix text
,'EN' -- _sLang text
,1 -- _iStartId bigint
,1000 -- _iLimit int
,NULL::smallint[][2] -- _aFilterEvents smallint[][2]
,NULL -- _aFilterShift integer[]
,NULL -- _aFilterUsername text[]
,NULL -- _aFilterPattern text[]
,NULL -- _aFilterSeq text[]
,NULL -- _aFilterTicketUid bigint[]
,NULL -- _aFilterTicketProductionId text[]
,NULL -- _aFilterTicketProductionsub1Id text[]
,NULL -- _aFilterTicketProductionsub2Id text[]
,NULL -- _aFilterTicketCustomerId text[]
,NULL -- _aFilterTicketArticleid text[]
,NULL -- _aFilterUserState Smallint[]
,NULL -- _aFilterSintralState Smallint[]
);
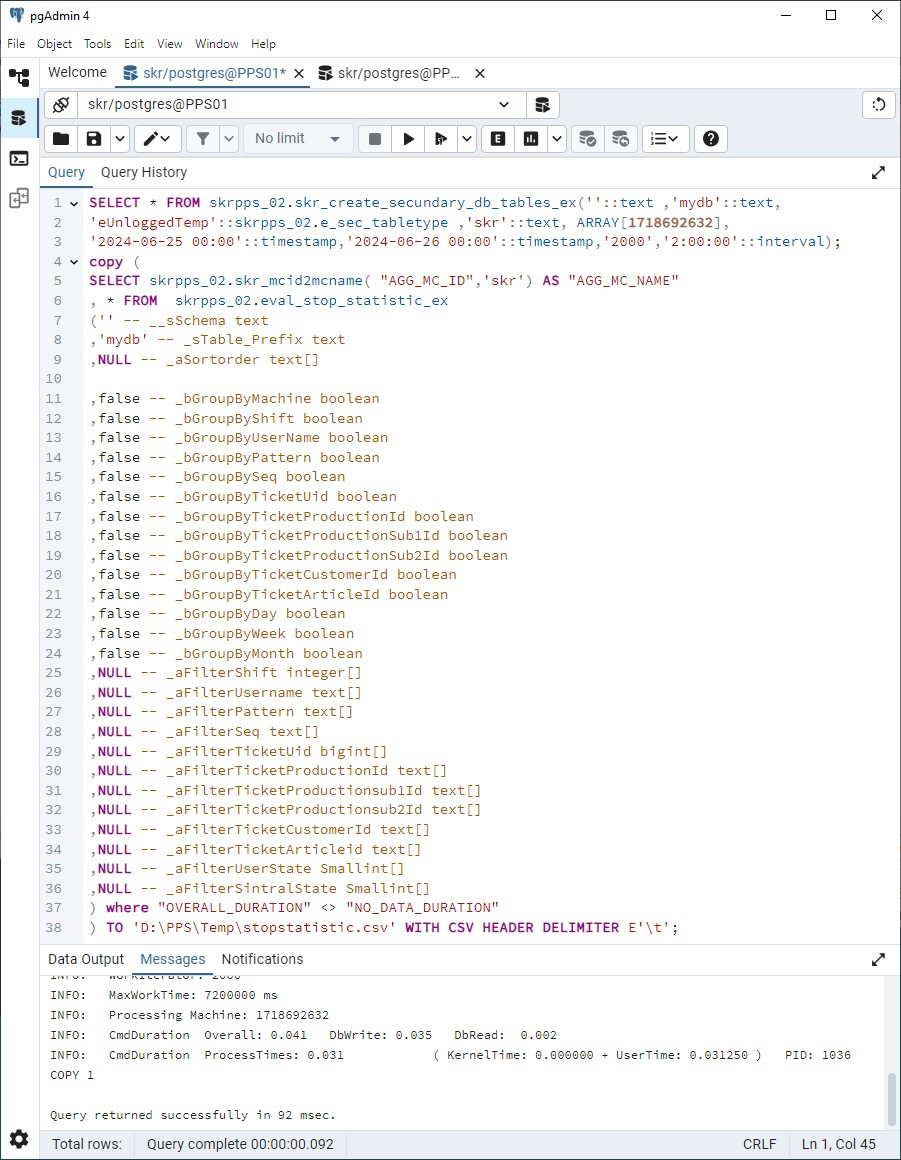
Export the report to a CSV file:
Suppose you want to determine the run time of a machine on a given day.
The stop statistics provide this information in the RUN_DURATION column.
You can use the Copy Postgres command to export the results table to a CSV file.
- 1
- Create the Secundary DB for the desired day and machine.
- 2
- Create the desired report.
- 3
- Proceed in the same way for further reports, provided that the Secundary database is required.
Otherwise, you can call up the desired table directly.
You can test the call in the pgAdmin4 program:SELECT * FROM skrpps_02.skr_create_secundary_db_tables_ex(
''::text ,'mydb'::text,
'eUnloggedTemp'::skrpps_02.e_sec_tabletype ,'skr'::text, ARRAY[1718692632],
'2024-06-25 00:00'::timestamp,
'2024-06-26 00:00'::timestamp,
'2000','2:00:00'::interval);
copy (
SELECT skrpps_02.skr_mcid2mcname("AGG_MC_ID",'skr') AS "AGG_MC_NAME"
, * FROM skrpps_02.eval_stop_statistic_ex
('' -- __sSchema text
,'mydb' -- _sTable_Prefix text
,NULL -- _aSortorder text[]
,false -- _bGroupByMachine boolean
,false -- _bGroupByShift boolean
,false -- _bGroupByUserName boolean
,false -- _bGroupByPattern boolean
,false -- _bGroupBySeq boolean
,false -- _bGroupByTicketUid boolean
,false -- _bGroupByTicketProductionId boolean
,false -- _bGroupByTicketProductionSub1Id boolean
,false -- _bGroupByTicketProductionSub2Id boolean
,false -- _bGroupByTicketCustomerId boolean
,false -- _bGroupByTicketArticleId boolean
,false -- _bGroupByDay boolean
,false -- _bGroupByWeek boolean
,false -- _bGroupByMonth boolean
,NULL -- _aFilterShift integer[]
,NULL -- _aFilterUsername text[]
,NULL -- _aFilterPattern text[]
,NULL -- _aFilterSeq text[]
,NULL -- _aFilterTicketUid bigint[]
,NULL -- _aFilterTicketProductionId text[]
,NULL -- _aFilterTicketProductionsub1Id text[]
,NULL -- _aFilterTicketProductionsub2Id text[]
,NULL -- _aFilterTicketCustomerId text[]
,NULL -- _aFilterTicketArticleid text[]
,NULL -- _aFilterUserState Smallint[]
,NULL -- _aFilterSintralState Smallint[]
) where "OVERALL_DURATION" <> "NO_DATA_DURATION"
) TO 'D:\PPS\Temp\StopStatistic.csv' WITH (FORMAT CSV, HEADER TRUE, DELIMITER E'\t') ;
The directory of the CSV file must have write permission for the _Skr2DbUser.
You can split the call into a batch and a *.sql file.
- 1
- Copy the first text into a
StopStatistic.batbatch file. - 2
- Copy the second text into the
export_report.sqlfile. - 3
- Adjust the time period, machine IDs, and the target directory.
- The columns are separated by tabs and the result is written to the CSV-file
'D:\PPS\Temp\StopStatistic.csv'. - You can open the file in Excel via data import:
@echo off
REM File StopStatistic.bat
SET "PGPATH=C:\Program Files\Stoll\skr3_15\PostgreSql\15.12-1\bin"
SET PGPASSWORD=skrfrontend
SET SQL_FILE="D:\PPS\Temp\export_report.sql"
SET ERROR_LOG="D:\PPS\Temp\psql_error.log"
del %ERROR_LOG% 2>NUL
"%PGPATH%\psql" -U skrfrontend -d skr -h localhost -f %SQL_FILE% > %ERROR_LOG% 2>&1
if %ERRORLEVEL% NEQ 0 (
echo Error executing PostgreSQL commands!
echo Check %ERROR_LOG% for details.
type %ERROR_LOG%
pause
) else (
echo CSV export completed successfully.
echo Check %ERROR_LOG% for any warnings or notices.
type %ERROR_LOG%
)


-- File export_report.sql
\set ON_ERROR_STOP on
SELECT skrpps_02.skr_create_secundary_db_tables_ex (
''::text,
'mydb'::text,
'eUnloggedTemp'::skrpps_02.e_sec_tabletype,
'skr'::text,
ARRAY[1718692632],
'2024-06-25 00:00'::timestamp,
'2024-06-26 00:00'::timestamp,
'2000',
'2:00:00'::interval
);
\copy (Select skrpps_02.skr_mcid2mcname ( "AGG_MC_ID",'skr') AS "AGG_MC_NAME", * from skrpps_02.eval_stop_statistic_ex ('' , 'mydb', NULL, true, false, false, false, false, false, false, false, false, false, false, false, false, false, NULL, NULL, NULL, NULL, NULL, NULL, NULL, NULL, NULL, NULL, NULL, NULL) WHERE "OVERALL_DURATION" <> "NO_DATA_DURATION") TO 'D:\PPS\Temp\StopStatistic.csv' WITH (FORMAT CSV, HEADER TRUE, DELIMITER E'\t') ;